(back to the Documentation)
Aviation climate impacts
1. Introduction
2. Altitude and climate impact
3. Local/regional versus global climate impacts
4. Total climate impacts from aircraft
5. Aviation and climate impacts : consequences for Belgium
1. Introduction
Air transport has specific climate impacts compared to other transport modes mainly because most emissions (see also Aircraft emissions) occur at a high altitude. A second characteristic concerns the geographical location of aviation climate impacts: aircraft causes global warming as well as more local/regional climate impacts.
Therefore, the total climate impact from aircraft is more important than climate impact from "classic GHGs" (see Kyoto GHGs) only and has to be qualified according to the time horizon considered.
2. Altitude and climate impact
Due to the combustion of fuel, aircraft produces different emissions harmful to the environment and human health.
As aircraft flies at high altitude, some of the emitted pollutants have stronger environmental effects than if they were emitted at ground level: they influence the local atmosphere chemistry (e.g. NOx interacts with methane and with ozone in the high atmosphere). Under specific meteorological conditions (when the temperature is low and the humidity high enough), aircraft induces condensation trails, which can evolve into cirrus clouds. This additional cloud cover is referred to as aircraft induced cloudiness (AIC).
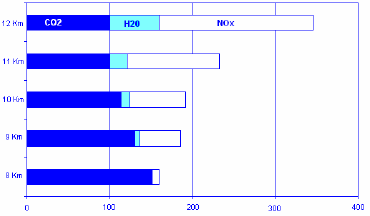
The graph below illustrates the influence of flying altitude on climate impact from different aircraft emissions (CO2, NOx and water vapour, not considering contrails or changes in cirrus clouds). The value of reference (100) corresponds to the CO2 radiative forcing at an altitude of 12 km. Even if the importance of CO2 climate impacts tends to diminish with increasing altitude, the global climate impact of the considered emissions grows sharply because of the increasing effects of NOx and H2O. Consequently, the total climate impact of an aircraft at 12 km is more or less twice as large as the impact at 8 km.
Relative climate impact of CO2, NOx and H2O according to the altitude
|
Source : IPCC 1999 (p. 257, Figure 7-37)
As regards climate policy tools and mitigation efforts, it is essential to tackle the climate impacts from the aviation sector in a comprehensive way, keeping in mind that the adoption of incomplete measures could worsen the climate impact of the sector.
3. Local/regional versus global climate impacts
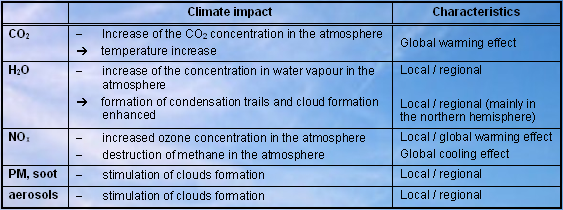
Aircraft emissions induce climate impacts because they modify the radiative forcing balance of the atmosphere through chemical interactions with existing gases (e.g. methane and ozone) and through the increase of the concentration of CO2 and water vapour.
Given the fact that CO2 has a long lifespan, it accumulates and is mixed homogeneously in the atmosphere. Its climate impact occurs therefore on a global scale (global warming effect). Methane destruction by NOx emissions in the higher atmosphere also has a global impact due to the relative long lifespan of methane in the atmosphere (global cooling effect).
The climate impacts of other aircraft emissions are more closely located along the main aircraft routes (the majority of them are localised in the northern hemisphere) because they (or their indirect effects) are short-lived and/or do not have the time to mix homogeneously in the atmosphere (see table below). It has to be noticed that climate impacts generated by water vapour have in total a warming effect.
Climate influence of different aircraft pollutants
|
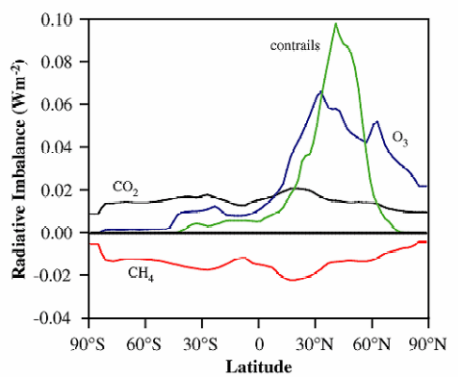
The graph below illustrates the different behaviour of aircraft induced climate impacts : CO2 and CH4 generate a well distributed radiative imbalance as a function of latitude, while the radiative imbalance caused by contrails and ozone (O3) is much greater between the latitudes 30°N and 60°N. It is to be noted that Belgium is situated around 50°N.
Repartition of aircraft climate impacts according to the latitude
|
Source: IPCC special report, "Aviation and the global atmosphere", 1999
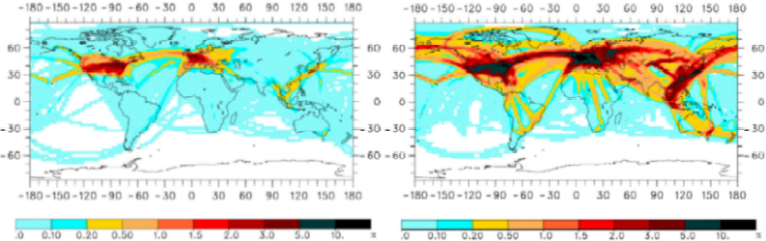
The geographical coverage of persistent contrails is illustrated below with a comparison between 1992 and 2050 according to the forecasted air traffic growth from the IPCC development scenario Fa1.
The regional impact is quite clear since most contrails are induced along the main air corridors and the intensity of the cover increases with the growth in air traffic on the main routes. It is to be noticed that Belgium is right in the middle of the main European air knots and will suffer from one of the most important contrail covers. Moreover, this contrail cover is essentially due to overflights of the Belgian territory (see point 4 for more details).
Persistent contrails cover (in %) for 1992 (left) and 2050 (right), linear weighting
|
Sources :
Sausen et al., A diagnostic study of the global distribution of contrails part I : present day climate, Theoretical and Applied Climatology 61, 127-141, 1998 (left graph)
Gierens et al., A diagnostic study of the global distribution of contrails part II : future air traffic scenarios, Theoretical and Applied Climatology 63, 1-9, 1999 (right graph, under Fa1 development scenario of the IPCC)
4. Total climate impacts from aircraft
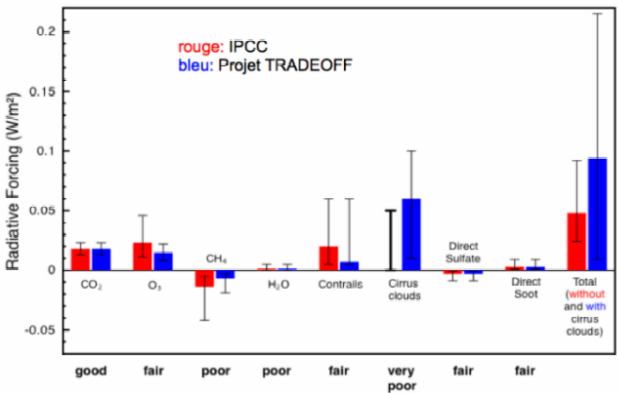
The first global assessment of the total climate impact from the aviation sector was made by the IPCC special report "Aviation and the global atmosphere" (1999). The red bars in the graph below illustrate the results obtained for the total aircraft fleet in 1992, and includes direct (e.g. concentration increase in CO2, H2O, soot, etc.) or indirect effects (e.g. interaction of NOx emissions on methane destruction and ozone formation/destruction ; formation of contrails and cirrus).
More recent results from European projects such as Tradeoff (see blue bars in the graph below) show that the estimation of the contribution to radiative forcing due to NOx (via methane and ozone) and due to linear contrails has been lowered since IPCC 1999. This project gives a first best estimation for the radiative forcing due to spreading cirrus clouds which is similar in magnitude as the total of all other gases including CO2. The uncertainty range (expressed in black intervals in the graph below) for the cirrus remains very large, whilst that for other gases has been reduced.
Relative importance (expressed in radiative forcing changes) of aircraft climate impacts
|
Source : Schumann 2005, "Formation, properties and climatic effects of contrails", Comptes Rendus Physique 6 4-5, 549-565
5. Aviation and climate impacts : consequences for Belgium
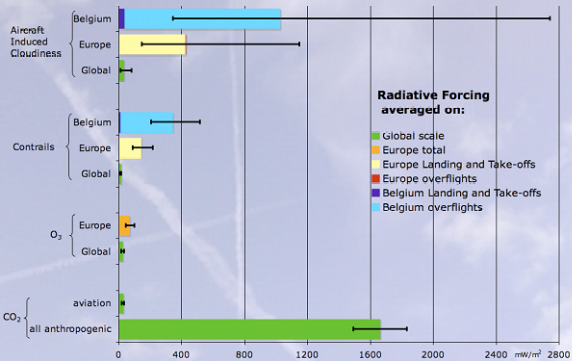
The bar chart hereafter gives the radiative forcing (RF) of:
- total anthropogenic CO2,
- CO2 emitted by airplanes,
- the RF of ozone produced by air traffic, contrails and aircraft induced cloudiness (AIC),
- as well as an estimation of their likeliness range (error bars).
Although this chart does only represent preliminary results of the ABC Impacts project based on certain hypothesis that need to be confirmed (see also Calculations RF bar chart, Andrew Ferrone 2007), it is interesting to note that the situation in Belgium is very different from that of Europe.
Whereas in Europe overflights (without landing or taking off in any European airport) represent only a tiny portion of all flights (less than 1%), they represent the majority of the flights over the Belgian territory (~70%). This is reflected in the RF of contrails and AIC produced by these flights.
Radiative forcing due to :
|
Source : ABC Impacts, ASTR calculations based on ETEC database, 2007
In Belgium the impact of LTO flights represent only ~4% of RF due to contrails or AIC as most of the flights taking off or landing in Belgium do not reach an altitude where contrails can be produced.
Belgium is thus receiving important climate impacts (imbalance in radiative forcings inducing local temperature changes, enhanced cloudiness) from these flights that do not contribute to the economy of the country.
It is important to note that although the RF from AIC in Belgium is of the same order of magnitude than that of all anthropogenic CO2, this does not imply that the temperature increase generated by these radiative forcing imbalances will be the same, as the climate system will be able to disperse the impact of such a strong local forcing.
