(back to the Documentation)
Maritime transport global trends
1. Introduction
2. European trends
3. Belgian trends
4. Forecasts
1. Introduction
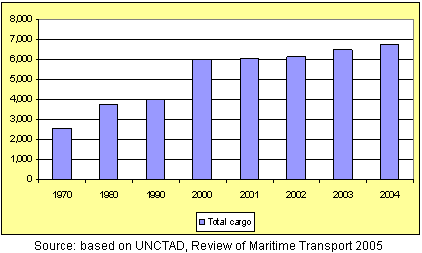
The growth of maritime transport is strongly correlated with the growth of international trade. An increase of 3,8% in world output led to a strong increase in world seaborne trade in 2004. In 2004, global maritime transport reached 6,76 billion tons, meaning a growth rate of 4,3%.
World sea trade development
|
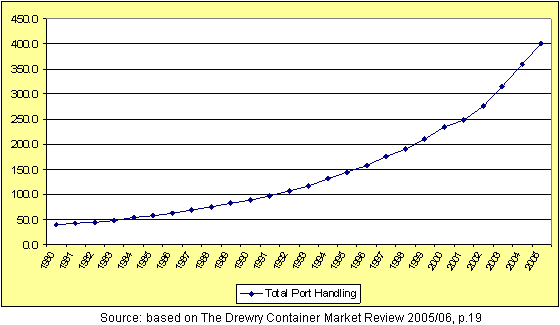
Container shipping has been the fastest growing sector of the maritime sector in the last two decades. Today container traffic is estimated to account for more than 70% of international seaborne trade by cargo value. In 2004, an estimated 928 million tons of containerized cargo was transported by sea in international and domestic trades. In their 2005/06 Container Market Review, the Drewry Shipping Consultants indicate a solid growth of 11,2% in container activity, reaching 400 million TEU.
Maritime container development
|
2. European trends
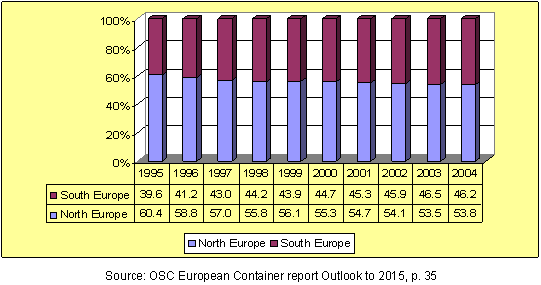
According to the OSC, container demand in Europe and the Mediterranean increased by 126% over the last decade and by 40% over 2000-05, to reach 77,23 million TEU. This means a minimum 8% annual increase. The impressive increase from 39,6% to 46,2% in South Europe and the Mediterranean is due to EU enlargement, port liberalization and increasing containerization.
Relative container traffic evolution in Northern and Southern Europe
|
2.1 Northern Europe
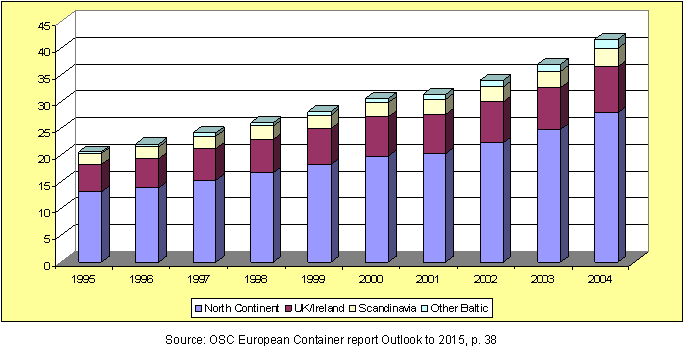
Container throughput doubled to 41,6 million TEU over 1995-2004. Over 2000-2004, this corresponds to an increase by 36% or a 7,2% annual growth. Ports in the Northern part of the continent in Germany, Benelux and France dominate the range with a share increase from 63,7% to 67,2% over the decade.
North Europe: Container throughput by port region (m TEUs)
|
2.2 Southern Europe and the Mediterranean
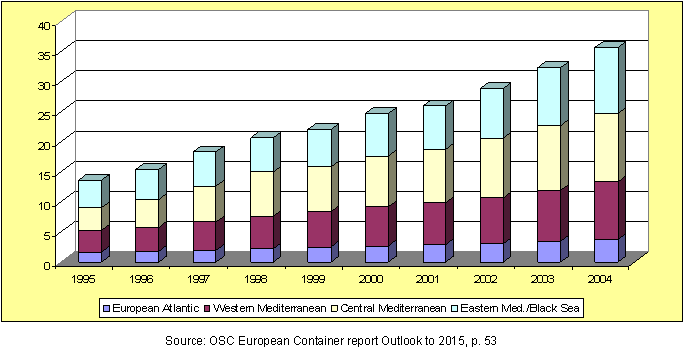
Container growth in Southern Europe and in the Mediterranean area increased up to 35,66 million TEU in 2004. Considering the period 2000-2004, there has been an increase of 44,7% (8,94% annual increase). The driving ports for the growth in Southern Europe are the Central Mediterranean ports which are in Italy, Malta, the Adriatic countries and Tunisia.
Container throughput by port region in Southern Europe / Mediterranean(m TEUs)
|
3. Belgian trends
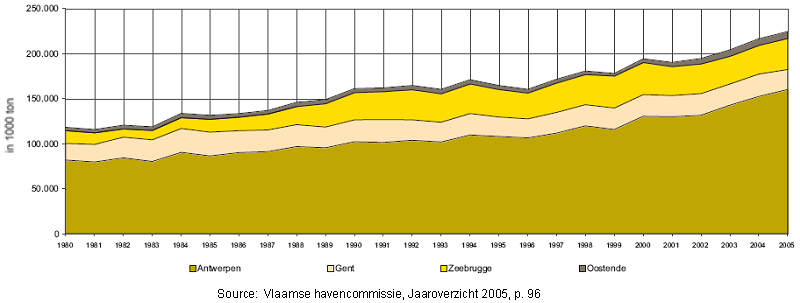
In general all Flemish ports realized an impressive growth over the last period of 25 years. In total this growth represents 90%. Only Ghent shows a small decline in 2005. The port of Antwerp is clearly the main port of Belgium and represents 81,7% of the total volume of 225 million tons in 2005. It is followed by Zeebrugge with 17,8% ; Ghent with 0,4% and the smallest but still growing port of Ostend with 0,1%.
Total maritime traffic in Flemish ports
|
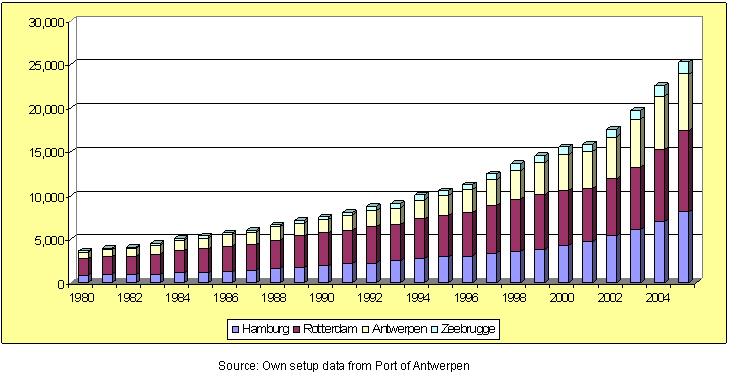
The evolution of maritime transport in Belgium can be analyzed together with the ports in the Hamburg - Le Havre range. In 2005, with an increase of 4,5% a total transhipment of 956,3 million tonnes is realized in this range. The market share of the Flemish ports in the range has settled itself since 2001 between 23,5% and 23,9%. In 2005, the market share of the ports of Antwerp and Zeebrugge increased their positions respectively to 23,7% and 16,7% whereas the ports of Ghent and Ostend loose market share.
Container throughput by ports of Hamburg, Rotterdam Anwerpen and Zeebrugge (in thousand TEUs)
|
Focusing more in detail to the evolution of container traffic, throughput in the port of Antwerp grew by 9,3% in 2005 compared to 2004 and reached 6,48 million TEU. The Port of Zeebrugge outperformed this with an 11,4% growth and reached 1,40 million TEU. The Port of Ghent and the ro-ro port of Ostend have shown a decrease in container transport.
Container traffic in Flemish ports (in TEU)

|
4. Forecasts
4.1 Global forecasts
Containerized liner shipping has been the fastest growing sector of the maritime transport especially during the last two decades. With annual growth rates of over 10%, container traffic is today estimated to account for more than 70% of international seaborne trade by cargo value. Global forecasts of container traffic activity are provided by independent shipping consultants (Drewry and the Ocean Shipping Consultants).
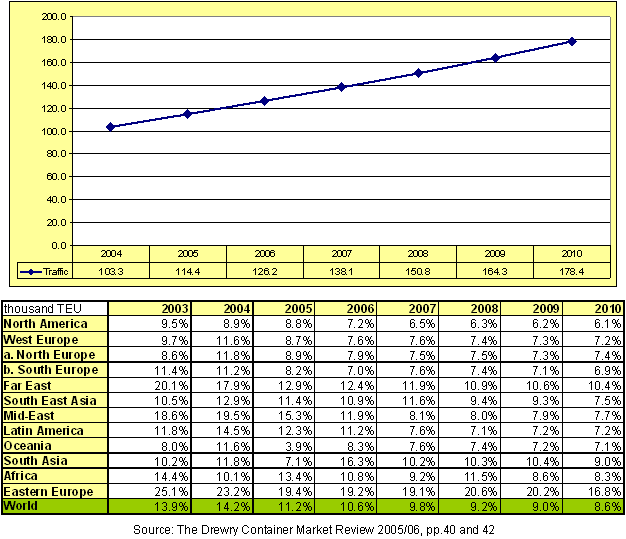
Prognoses for the future traffic are drawn based on global and regional economic activity. Considering container activity, a slight fall in the annual growth rate is expected, ranging from 13,9% down to around 8,6% by 2010 according to the Drewry Shipping Consultants. The main reason for this decline would be the expected slowdown of the growth of the Chinese economy from 2006. Any slowdown of the growth in China is causing lower rates of global growth since Chinese ports accounted for over 20% of global activity.
Forecasted development of world container traffic and container growth by region in the world
|
On the other hand, the Oceans Shipping Consultants make their forecasts using two growth scenarios. Their projection for the growth of the total world container traffic is 7,8% for the low growth scenario and 10,3% for the high growth scenario through 2015.
Following the high growth scenario, the growth in Northern Europe would be 10%. In Southern Europe an annual growth of up to 14,3% is forecasted in the positive economy scenario.
4.2 Belgian forecasts
Two forecasts are analyzed referring to Belgium, one study is a study conducted by VITO and ECONOTEC establishing key assumptions for calculation of mid and long term greenhouse emission scenarios and the second one is a study for the port of Antwerp by the European Center for Strategic Analysis. The key findings of these two projects are summarized below.
4.2.1 VITO/ECONOTEC Study
The Federal Ministry for the Environment asked VITO and ECONOTEC to undertake a study aimed at establishing a set of key assumptions, to be the basis for the calculation of emission projections and assessment of emission reductions for the mid and long term specifically for Belgium. The study followed the following four scenarios:
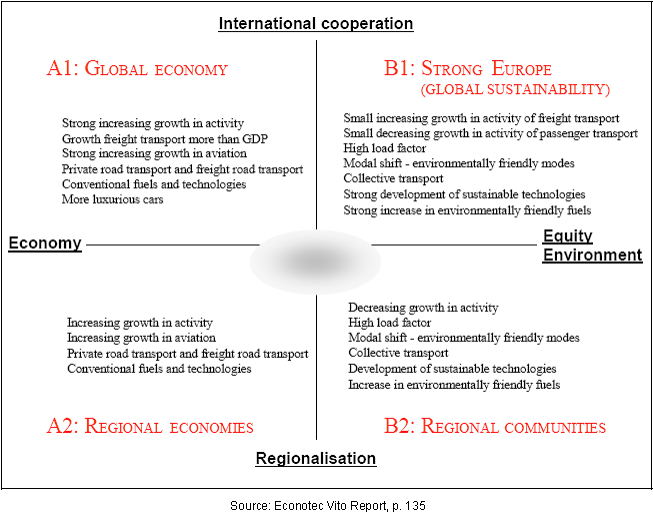
Description of scenarios for transport
|
4.2.2 ECSA Study
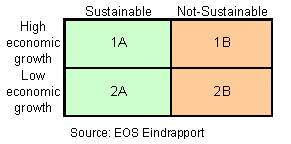
Having a time horizon of 25 years, ECSA conducted an economic development study for the port of Antwerp. Two scenarios - high and low economic growths - were combined with sustainability, leading to four scenarios.
Description of scenarios for development
|
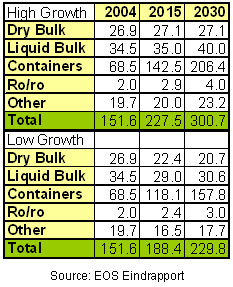
The following results are found in the study concerning the traffic in the port of Antwerp. Depending on economic growth, the maritime traffic would reach 188-228 million tonnes in 2015 by an increase of 24,3% - 50%. The growth would continue for the period 2015-30, leading to 230-301 million tonnes by an increase of 22% - 32,2%. Considering the high economic growth scenario, the total maritime transport would be doubled by 2030. This is mainly due to an increase of container traffic from 68,1 million tonnes in 2004 to 206,4 million tonnes in 2030. Annual growth is 1,9% - 3,6% for total maritime transport and 4,8% -7,5% for container transport.
Results of scenarios for maritime traffic
|
